
-

Paper2Agent: How MCP Turns Static Papers into Tools
Paper2Agent turns assets into callable tools using the Model Context Protocol (MCP), transforming figures, code, and data into reproducible workflows.
-

CodonBERT Explained: Context‑Aware Codon Optimization
CodonBERT treats coding sequences like sentences, learning context-aware patterns to boost protein expression beyond simple CAI optimizations.
-

This week’s top spatial transcriptomics papers 🧬 Week 26
Spatial transcriptomics reveals a disease-associated motor neuron state in ALS and maps heart, reproductive biology, and cancer tissue atlases.
-

Evo2 and DNA LLMs: Perplexity, Prompting, Genomic Design
Evo2 introduces genomic language models and examines perplexity, DNA prompting, and responsible design—framing safe, exploratory genomics.
-

SpliceVarDB: Validated splicing variants for splice-site
SpliceVarDB consolidates thousands of experimentally validated splicing variants across 8,000+ genes, enabling faster diagnostics and model benchmarking.
-
This week’s top spatial transcriptomics papers 🧬 Week 25
Spatial transcriptomics unveils conserved brain architecture, neuron diversity, and tumor microenvironment interactions, linking genes to function.
-
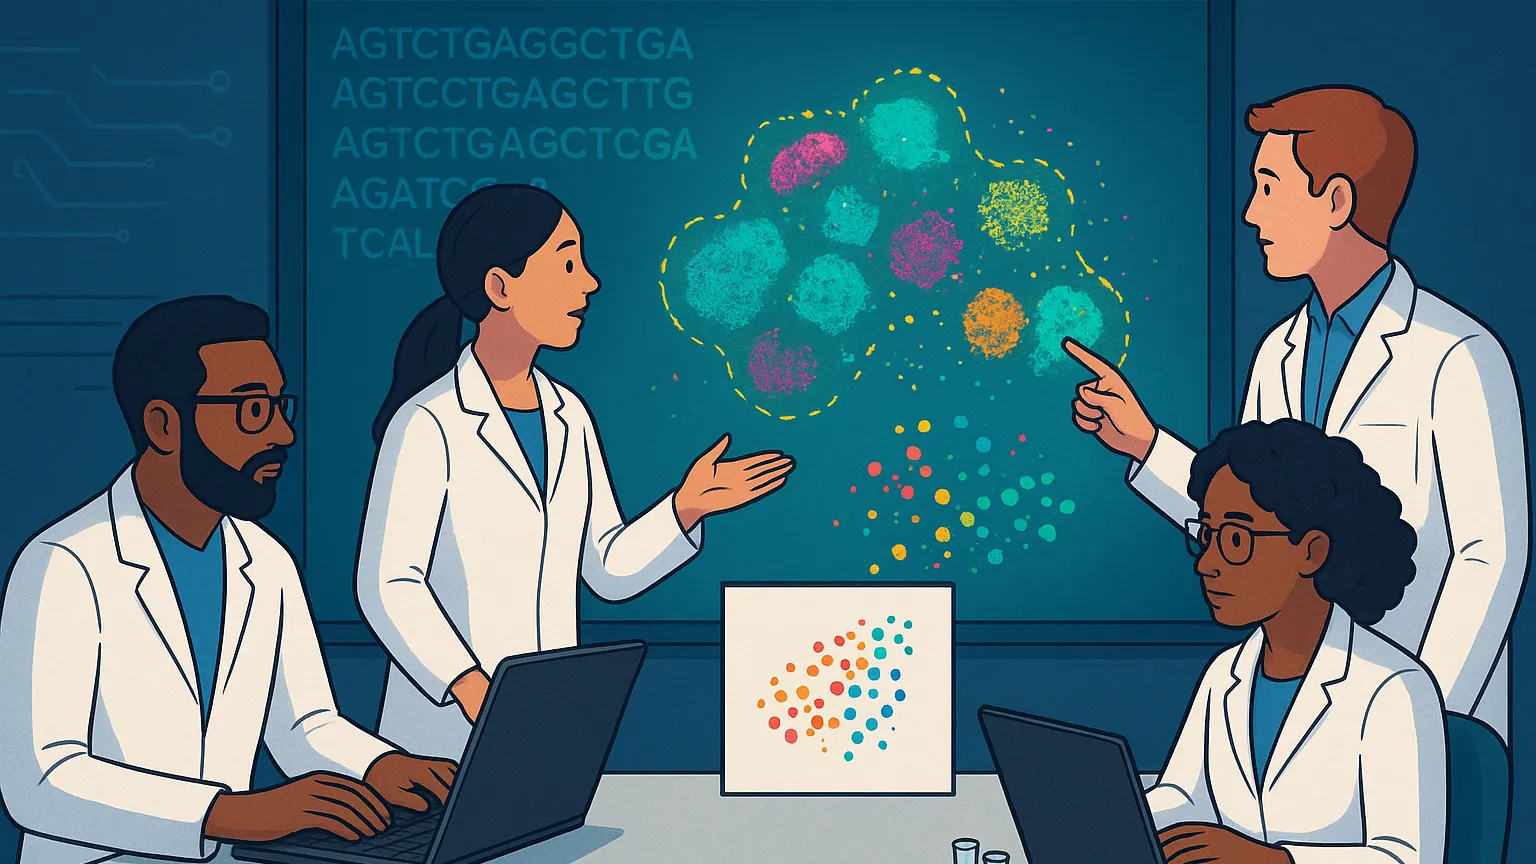
Cluster TCRs from 10x with TCRdist
Cluster TCRs from 10x data using TCRdist to group related receptors by similarity, turning exact clonotypes into biologically meaningful clusters.
-
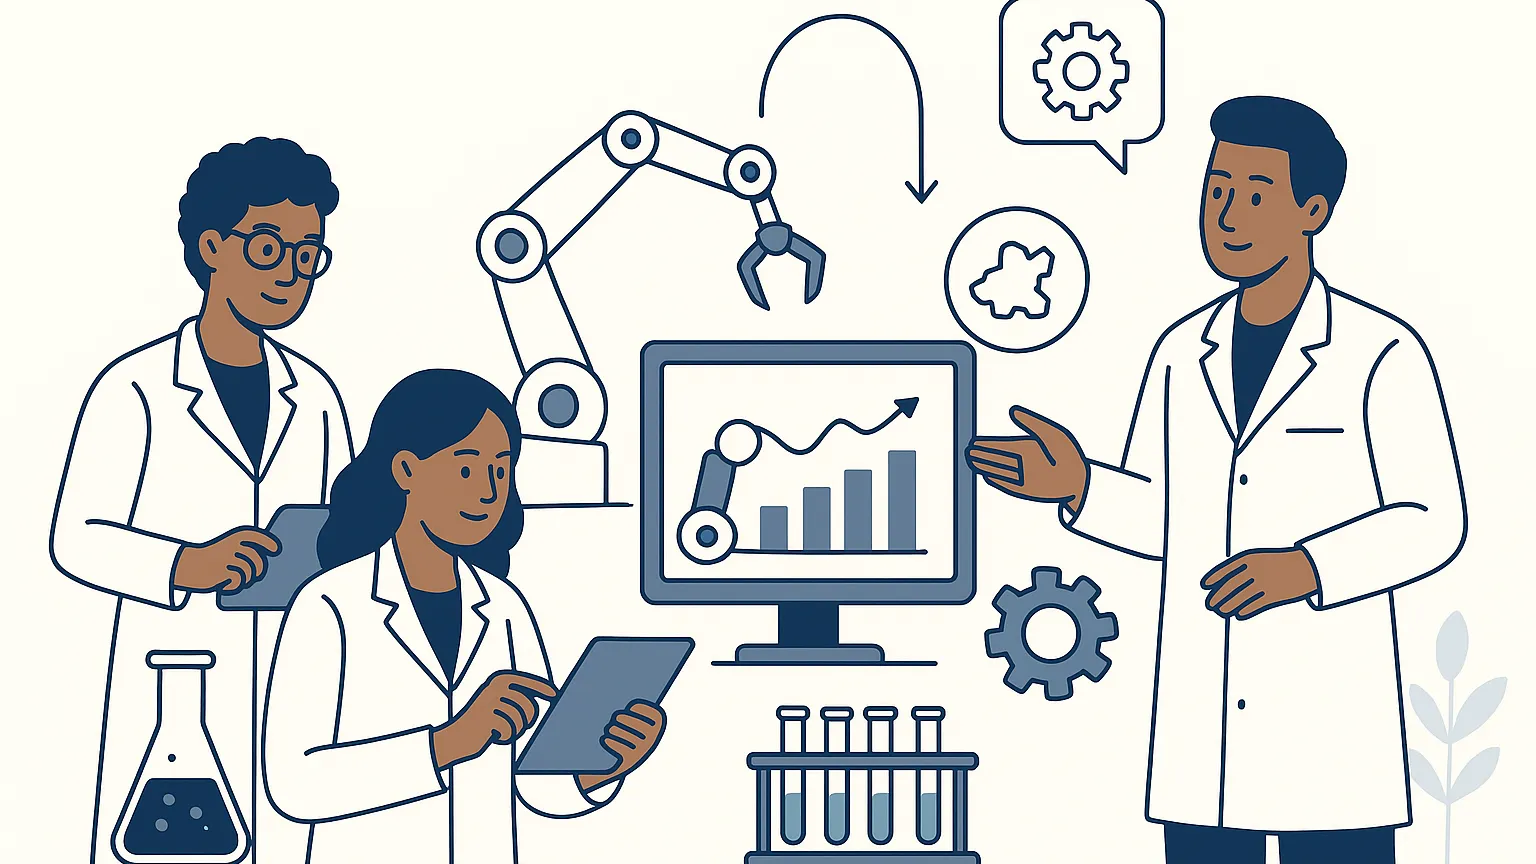
Autonomous Experimentation Loops: Robots, Analytics
Autonomous Experimentation means designing, running, and interpreting experiments in a continuous loop, linking Robotics, Analytics, and Decision Engines.
-
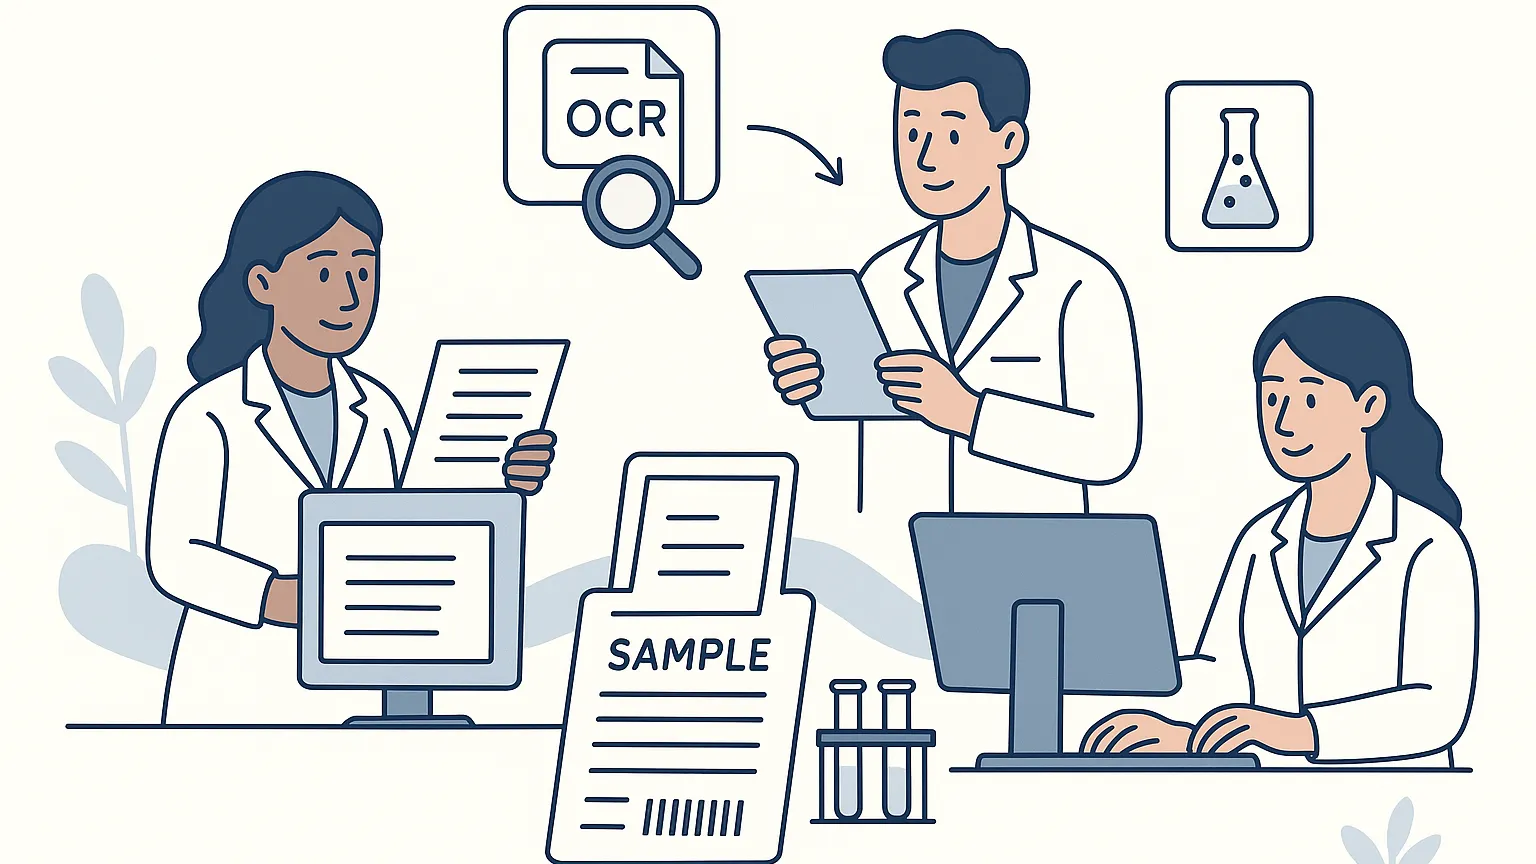
OCR and Digitization for Paper Entry in the Digital Lab
OCR and Digitization turn paper entry forms into usable data, reducing manual entry and speeding up lab registration.
-

Job Opening – Student Job Agentic AI
Working student in Data Science / AI to support the development of AI agent systems for life science applications. The role…