Skip to content
Logo of company EVOBYTE
  • Home
  • Bioinformatics
    • Data Analysis Services
    • ReadStore Omics Data App
  • Bio AI
  • Data Science
  • Digital Lab
Email
Logo of company EVOBYTE
  • Home
  • Bioinformatics
    • Data Analysis Services
    • ReadStore Omics Data App
  • Bio AI
  • Data Science
  • Digital Lab
  • Cartoon image of researchers in lab coats using laptops, tablets, and books. Icons of a brain, gear, database, and lock are visible.
    Digital Lab

    AI Knowledge Base for AI Models From Lab Protocols

    Building an AI knowledge base for AI models from lab protocols enables an AI assistant to answer questions, cite sources, and improve accuracy in the lab.

Blog categories

  • AI & Machine Learning
  • Bioinformatics
  • Clinical Trials
  • Digital Lab
  • Digitales Labor
  • General
  • New Publications
  • News
  • ReadStore
  • Tools & Technology
  • Tutorial
  • Uncategorized
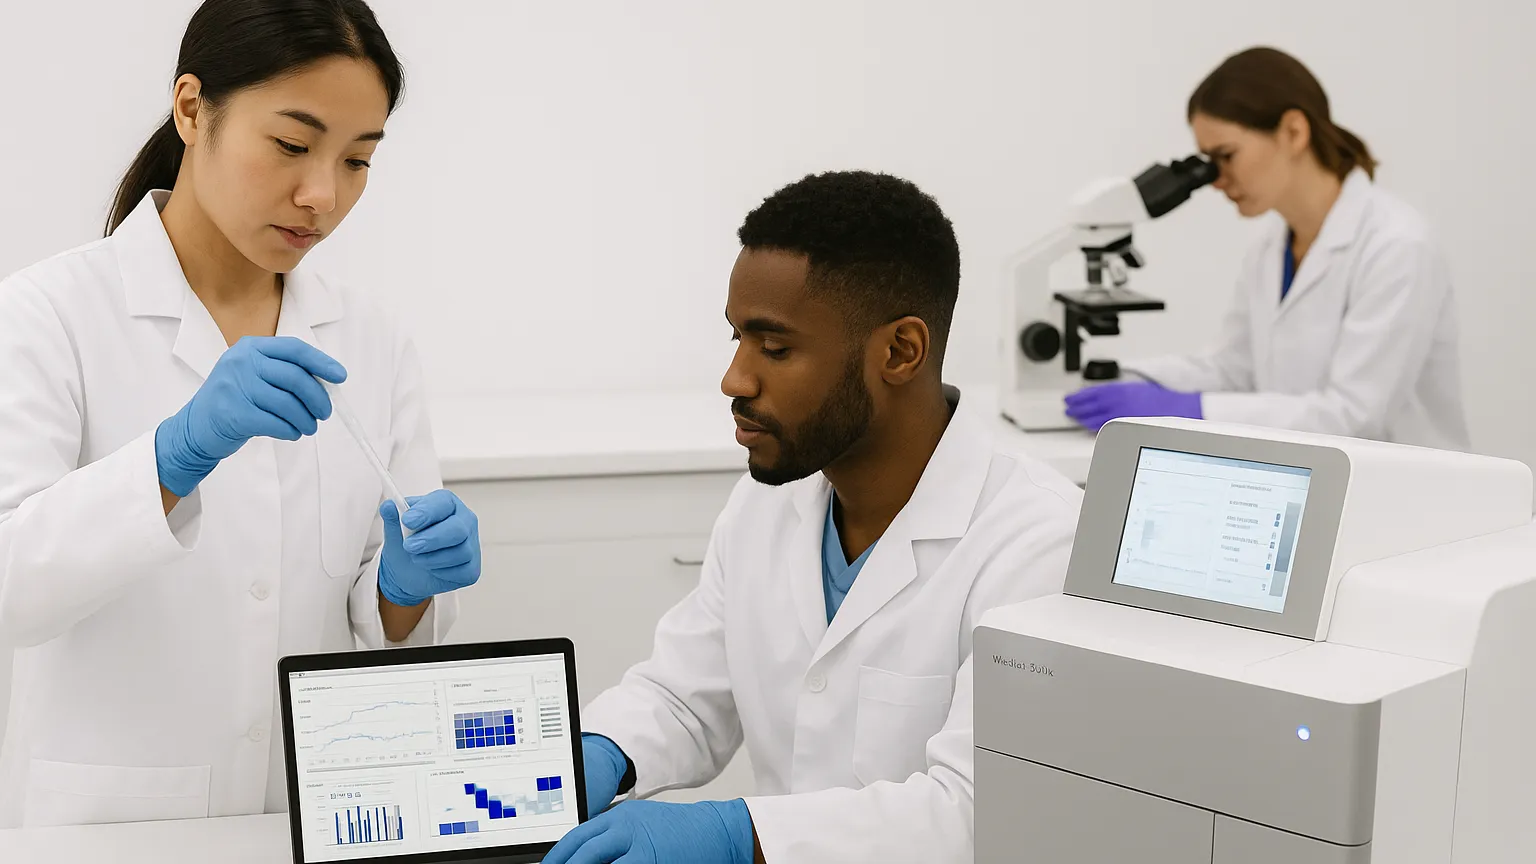
  • Two scientists in lab coats working with a pipette and a laptop displaying graphs, while another scientist observes through a microscope in the background.
    Bioinformatics

    Ambient RNA in scRNA-seq and how to remove it

    Ambient RNA can skew scRNA-seq results. Learn what it is, why it matters, and how DecontX cleans ambient contamination for clearer…

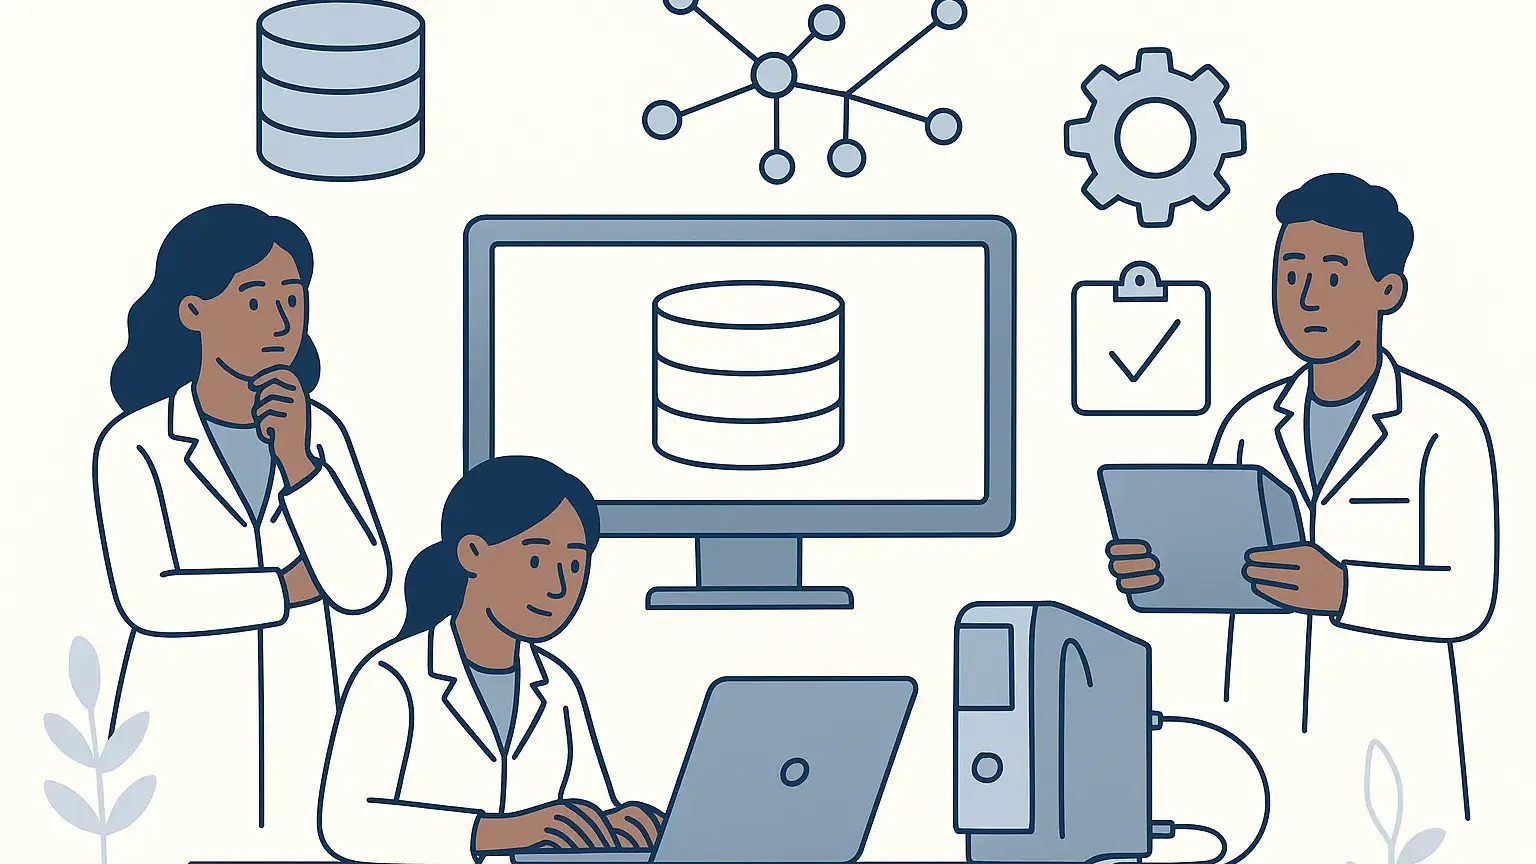
  • Illustration of two scientists with digital tablets, a computer displaying a graph, lab equipment, and recycling and clipboard icons.
    Digital Lab

    Tracking Material Consumption and Waste in a Digital Lab

    Real-time material tracking in a digital lab links usage to ERP, cutting costs, reducing waste, and shrinking storage.

  • Illustration of four scientists in a lab, one typing on a laptop labeled FASTQ, another pointing at a screen displaying a graph labeled BAM, with DNA strands in the background.
    Bioinformatics

    NGS File Format Primer: FASTQ, SAM/BAM, CRAM

    NGS file formats are the shipping labels of sequencing data. This guide unpacks FASTQ, SAM/BAM, and CRAM with quick checks and…

  • New Publications

    This weeks top spatial transcriptomics paper 🧬 Week 9

    Spatial transcriptomics reveals tumor microenvironment niches and biomarkers shaping cancer progression and immunotherapy across organs.

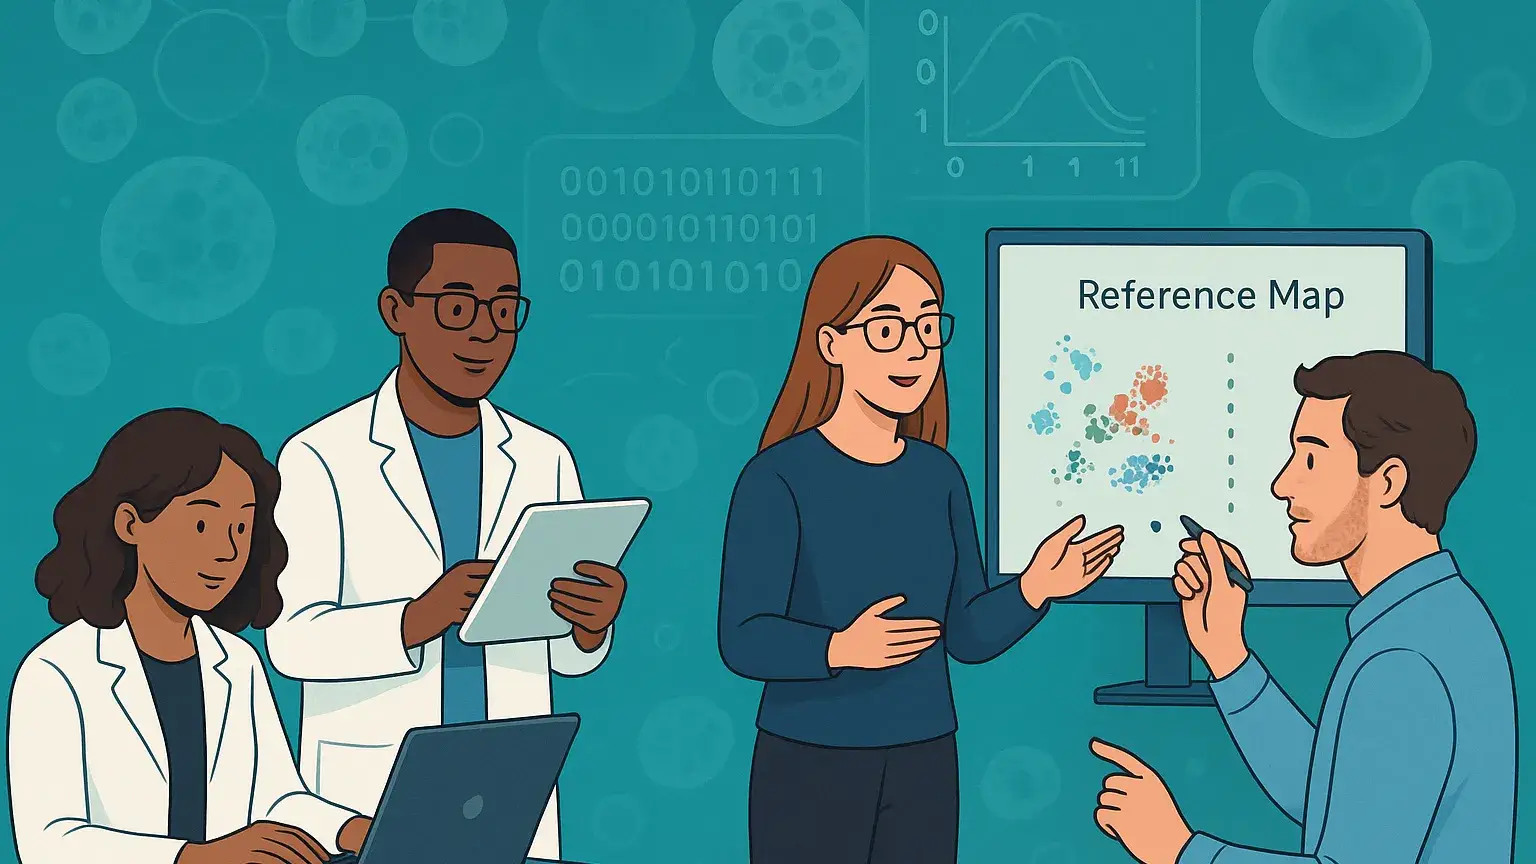
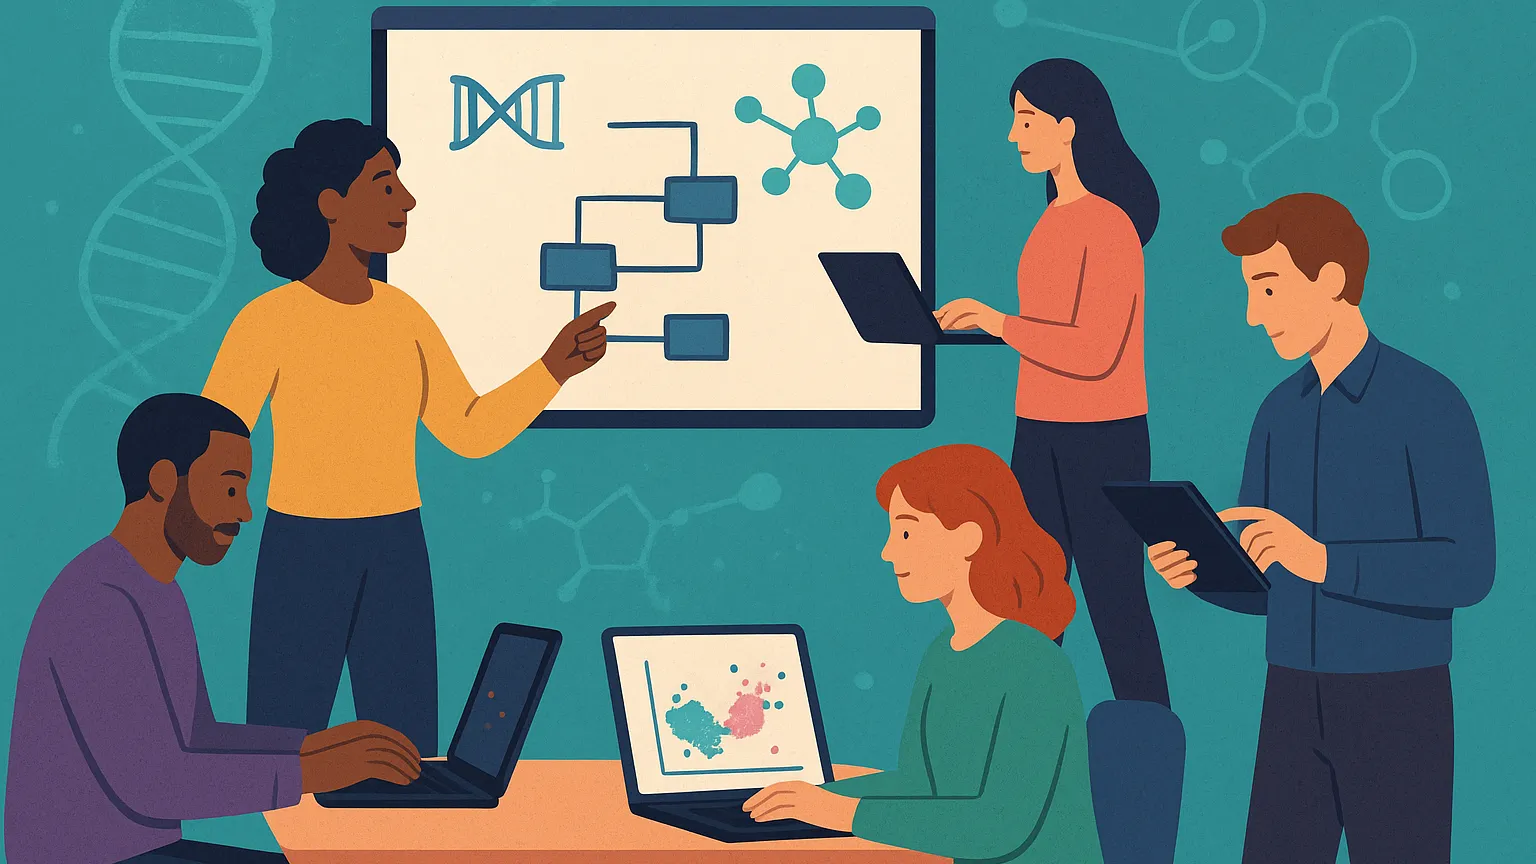
  • Four people in a meeting, looking at data visualizations on a computer monitor. One person is pointing at the screen, others are observing attentively.
    Bioinformatics

    From scGPT to scConcept: Models for Single-Cell Biology

    Foundation models for single-cell biology are moving from reconstruction to contrastive pretraining, yielding technology-agnostic, robust cell representations.

  • Illustration of healthcare professionals using digital devices and HL7 technology, with medical symbols in the background.
    Digital Lab

    HL7 FHIR in the Digital Lab: Data Standards

    HL7 FHIR standardizes lab data exchange, enabling secure, interoperable sharing between instruments, LIMS, and EHRs to speed results and improve quality.

  • Bioinformatics

    GeoMx DSP Explained: How It Works & When to Use It

    GeoMx DSP enables ROI-based, FFPE-friendly spatial profiling with UV-cleavable barcodes, delivering ROI-level counts for targeted RNA and protein panels.

  • New Publications

    This week’s top spatial transcriptomics papers 🧬 Week 8

    Spatial transcriptomics exposes MYCN-driven liver cancer niches, CD276-mediated chemoresistance in PDAC, CIS in HPV TSCC, and key cancer targets via TWAS.

  • Illustration of four people engaging in data analysis and visualization using tablets and charts, under the text 'Streamlit'. One person is sitting with a laptop, another holding a tablet, while two others discuss molecular and genetic diagrams.
    Bioinformatics

    Streamlit for Omics: Interactive Visualizations in Python

    Streamlit for Omics enables interactive, Python-based omics dashboards in minutes with live filtering and visuals.

←Previous Page
1 … 7 8 9 10 11 … 23
Next Page→

  • Home
  • Contact
  • Blog
  • About
  • Privacy Policy
  • Impressum

Copyright © 2026

Notifications