
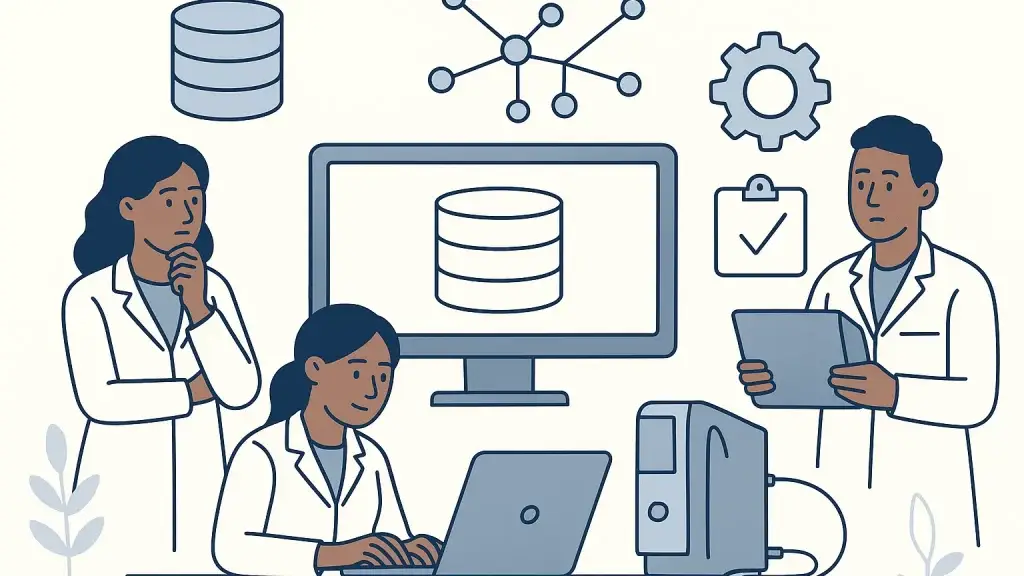

By EVOBYTE Your partner for the digital lab
A data warehouse is a central system that collects, stores, and organizes data from many sources so you can analyze it together. For laboratories, that means bringing instrument data, assay results, sample metadata, and even production and inventory records into one trusted source. Unlike a day‑to‑day database that powers a single app, a warehouse is designed for analysis across time and across systems. When labs treat the warehouse as the backbone of data management, teams answer questions faster, improve quality, and reduce manual work.
How a data warehouse compares to your LIMS ELN, and file server
Most labs already use a Laboratory Information Management System (LIMS) and often an Electronic Lab Notebook (ELN) (check our previous primer). These systems are great at running daily workflows: registering samples, booking instruments, recording steps, and enforcing permissions. Under the hood, each one has its own database optimized for quick transactions like “create a sample” or “update a status.” A data warehouse serves a different job. It aggregates data from the LIMS, ELN, spreadsheets, and raw instrument files, reshapes it into analysis‑ready tables, and keeps a consistent history. Because a warehouse scales for large queries and long time ranges, you can compare assays across months, link batches from different plants, and track instrument performance without slowing down your operational systems.
Think of it this way: if the LIMS answers “what is happening right now to this sample,” the warehouse answers “what patterns emerge across all samples over the past year, and what predicts failure next week.” That distinction matters in regulated labs too. The warehouse preserves context and lineage, which supports traceability and audit readiness when paired with good data management practices.
Why a single warehouse for assays and measurements matters
Lab data often lives in silos. An HPLC exports CSV files to a network drive. An LC‑MS stores runs in a vendor database. A plate reader writes XML. The LIMS holds sample IDs, but the naming in instrument files doesn’t always match. Analysts then copy and paste results into spreadsheets to reconcile everything. This is slow, fragile, and hard to reproduce.
A single warehouse brings order. First, it standardizes identifiers so every record ties back to the same sample, lot, method, and analyst. Second, it normalizes units and measurement contexts, so nanograms per milliliter in one system align with micrograms per liter in another. Third, it keeps historical versions, which lets you see what changed, when, and why. The result is a “single source of truth” for analysis, reporting, and oversight.
The benefits show up quickly. Turnaround time drops because analysts pull ready‑to‑use datasets instead of stitching files. Investigations move faster because you can pivot from an out‑of‑spec result to contributing factors such as reagent lots, calibration history, or ambient conditions. Management gets consistent KPIs and control charts that update automatically. Quality teams gain confidence because data lineage is visible and consistent. In short, one warehouse reduces friction and enables reliable, cross‑system insights.
Connecting instruments to the warehouse: practical considerations
The hardest part is often the first mile: getting instrument data into the warehouse with the right structure and context. Many instruments lack modern adaptors or open APIs. Some lock data in proprietary binary formats. Others export text files without clear headers, timestamps, or units. Even when vendors provide adaptors, they may not cover all result types or metadata. Labs also face inconsistent sample naming, missing method versions, and no common event time across systems.
These issues are real, but solvable with a thoughtful ingestion and modeling plan. Start by cataloging every instrument and file type in scope, along with where files land and who owns them. For devices without adaptors, set up stable file drops and build small, repeatable parsers that map each column to a well‑defined field. When formats are opaque, work with the vendor for export options or use standards such as AnIML or SiLA 2 where available to capture structure. If neither is possible, create a “bronze” landing zone in the warehouse for raw files and a “silver” layer for parsed tables, keeping the raw files for traceability.
Metadata often matters as much as numbers. Capture method name and version, instrument ID and firmware, calibration or standard curve details, operator, batch and sample IDs, temperature or humidity if relevant, and run timestamps. Enforce consistent units at ingestion time and store original units for reference. When multiple systems record time, align them with a clear source of truth and time zone, then compute offsets once so all downstream analyses are consistent.
In regulated settings, treat these pipelines like validated software. Use change control, versioned code, and test datasets for each parser. Log each load with counts and checksums. Keep lineage so you can trace a KPI on a dashboard back to the exact raw file and parser version. Modern cloud warehouses support these patterns with built‑in auditing and role‑based access, while on‑prem solutions can implement the same controls with IT support.
From raw instrument data to insight
Once ingestion is reliable, the warehouse unlocks a broad range of high‑value applications. Routine reporting is the first win. Instead of assembling weekly QC reports by hand, you can schedule queries that refresh dashboards before the morning meeting. Product teams and quality leaders see the same metrics, drawn from the same definitions, which reduces debate and speeds decisions.
Trend analysis comes next. With long‑term history in one place, you can review method performance over quarters, not days. If a dissolution test drifts seasonally or a spectrometer’s baseline creeps after maintenance, control charts will show it. Root‑cause analysis becomes more effective because you can correlate results with instrument usage, reagent lots, and environmental logs across time, not just within a single batch.
Batch release and investigations speed up as well. Suppose a potency result is out of trend. In a warehouse, you pivot from the flagged value to all similar lots, the calibration curve used, the standard preparation, and the analyst’s previous runs in minutes. That shortens review cycles and frees senior scientists to focus on true exceptions instead of data wrangling. For method transfer and validation, you can compare side‑by‑side performance across sites, instruments, and analysts using one consistent dataset, tightening confidence intervals and reducing rework.
Predictive analytics is a natural extension. With consistent, well‑labeled data, you can train models that forecast assay turnaround time, flag likely out‑of‑spec results before they happen, or predict preventive maintenance windows from drift patterns. Even simple models deliver value when they run against clean, unified data. Generative AI can help draft investigation summaries from warehouse queries, while guardrails ensure outputs cite sources and align with quality procedures.
Manufacturing and R&D both benefit. Pilot plants can link in‑process controls with release tests to see how upstream parameters affect outcomes. Discovery teams can unify screening results across instruments to rank hits faster and reduce bias. Stability studies improve when you can slice results by storage conditions, packaging lots, and measurement campaigns with one query. The warehouse becomes the foundation for a true lab intelligence layer.
Designing a lab‑ready warehouse that lasts
A sustainable design starts with a clear domain model. Define how samples, containers, batches, studies, instruments, methods, and results relate to each other. Keep it simple enough that new team members can read a table and understand what each row means. Name fields in plain language. Document unit conventions and business rules in the same place as the tables they govern.
Use a layered approach. Land raw files or vendor exports intact. Parse them into structured, typed tables that standardize units and keys. Build curated, analysis‑ready tables that join instrument data with LIMS and ELN context. Freeze these definitions with versioning so dashboards and models always know what to expect. Add lightweight quality checks, such as validating expected ranges, catching unit mismatches, and flagging missing metadata, and route exceptions for review instead of silently dropping records.
Security and access should be practical. Protect raw files and sensitive fields, but avoid bottlenecks by granting read access to curated tables that mask personal data and protect regulated attributes. Involve QA early so validation and audit needs inform the structure, not bolt on later. Choose a warehouse platform that your IT team can support and that scales with your data volume and query patterns, whether cloud or on‑prem.
Finally, plan for change. Instruments evolve, methods update, and naming conventions shift. Treat your ingestion code and data models as products, with owners, versioning, and release notes. When a vendor releases a long‑awaited adaptor, you can adopt it without breaking historical analyses because the curated layer stays stable while the raw and parsed layers absorb the new format.
Conclusion: a data warehouse turns scattered instrument data into a strategic asset
For beginners, the idea is simple but powerful: centralize instrument data and assay results in a data warehouse built for analysis, not daily transactions. With consistent identifiers, clean units, and preserved lineage, you accelerate routine reporting, investigations, and release decisions while raising data quality. You also create a foundation for predictive analytics that improves reliability and throughput. Connecting instruments is the hardest step, especially when adaptors are missing or formats are closed, but a layered approach and good data management turn these hurdles into routine engineering. The payoff is a lab that asks better questions and gets faster, more trusted answers from one place.
At EVOBYTE, we design and implement lab‑ready data warehouses, build custom connectors for instruments with missing adaptors, and deliver analytics that your QA, R&D, and operations teams can trust. If you’re ready to centralize your instrument data and modernize your data management, get in touch at info@evo-byte.com to discuss your project.
Further reading
Amazon Web Services — What is a data warehouse? https://aws.amazon.com/what-is/data-warehouse/
SiLA 2 — Open standards for laboratory automation and data exchange https://sila-standard.org/
AnIML — Analytical Information Markup Language overview https://animl.org/
U.S. FDA — Data Integrity and Compliance With Drug CGMP: Questions and Answers https://www.fda.gov/regulatory-information/search-fda-guidance-documents/data-integrity-and-compliance-drug-cgmp-questions-and-answers
Allotrope Foundation — Allotrope Data Format and frameworks for scientific data https://www.allotrope.org/